Matplotlib Basics
Use the Template to explore the basics of Matplotlib.
Create new cells with # %% as necessary.
Use the Plotting section, the Matplotlib Documentation, and the Matplotlib Cheetsheets for help.
Template
# %%
# Import matplotlib
import numpy as np # For generating data
# %%
# Variables for plotting
x = np.linspace(0.001, 100, 1000)
y = np.log(x)
rng = np.random.RandomState()
a = rng.uniform(0, 1, 10)
b = rng.uniform(0, 1, 100)
c = rng.uniform(0, 1, 100)
d = rng.normal(0, 1, 100)
# %%
# Create a figure with a single axis (plotting area)
# and create a line plot for x and y [.plot]
# %%
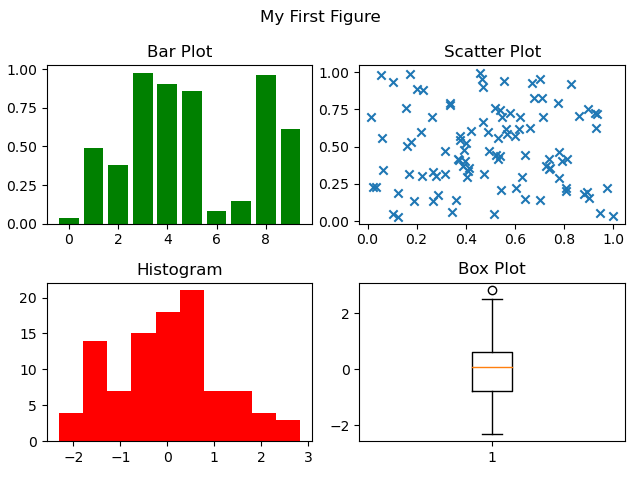
# Create a figure with four axes (2 rows, 2 columns)
# Axis 1: Barplot of a (color green) (use np.arange for the X axis) [.bar]
# Axis 2: Scatter plot of b and c (marker x) [.scatter]
# Axis 3: Histogram of d (color red) [.hist]
# Axis 4: Boxplot of d [.boxplot]
# %%
# Set the figure title [.suptitle]
# Set the title of each axis/plot [.set_title]
# Fix the layout/spacing [.tight_layout]
# %%
# Save the figure