Data Science Stack
The core packages in the data science stack are:
- NumPy - General scientific computing and linear algebra
- Pandas - Manipulation of Series and DataFrames
- Statsmodels - Estimation of statistical models
- Matplotlib - Plotting and making figures
NumPy
NumPy is the basis of the Python Data Science stack and it allows for scientific computing with multidimensional arrays. NumPy arrays are faster, consumes less memory, and is more convenient to use, compared to Python's built-in lists.
import numpy as np

np.array([1, 2, 3])
Arrays can be one-dimensional:

Or multidimensional (i.e. a matrix):

Specific values in the array can be reached through indexing:

The values can also be aggregated over the entire array:

Or over an axis:

Read more at NumPy: the absolute basics for beginners (image source).
Pandas
Pandas is built on top of NumPy and provides structures for working with tabular data in the form of Series and DataFrames.
A Series is a one-dimensional labelled array, while a DataFrame is a two-dimensional labelled data structure. In a DataFrame, the columns can have different types (numbers, strings, etc.).
import pandas as pd

s = pd.Series(s_data, index=s_index)
df = pd.DataFrame(df_data, index=df_index, columns=df_columns)
Both the rows and the columns are labelled and can be indexed.
df["x"]  # Column "x"
df[["x", "y"]]  # Columns "x" and "y"

df.loc["London", "Location"]  # Cell in row "London" and column "Location"
Read more at 10 Minutes to Pandas.
Statsmodels
Statsmodels allows for estimation of many statistical models, conducting statistical tests, and statistical data exploration.
import statsmodels.formula.api as smf

# Import data
data = pd.read_csv("path/to/data.csv")

# Fit regression model
model_fit = smf.ols("y ~ x + z", data=data).fit()

# Show summary
model_fit.summary()
Matplotlib
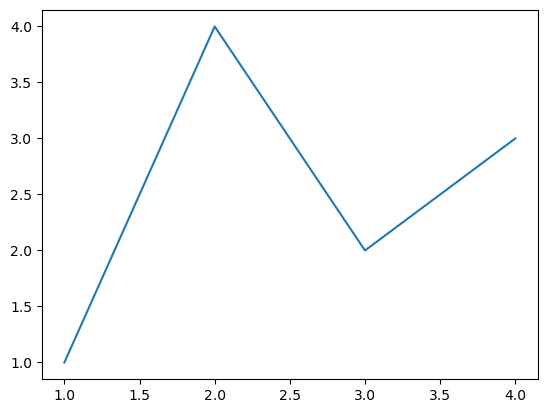
Matplotlib can plot the data of a NumPy array or Pandas DataFrame.
import matplotlib.pyplot as plt

fig, ax = plt.subplots()
ax.plot([1, 2, 3, 4], [1, 4, 2, 3])

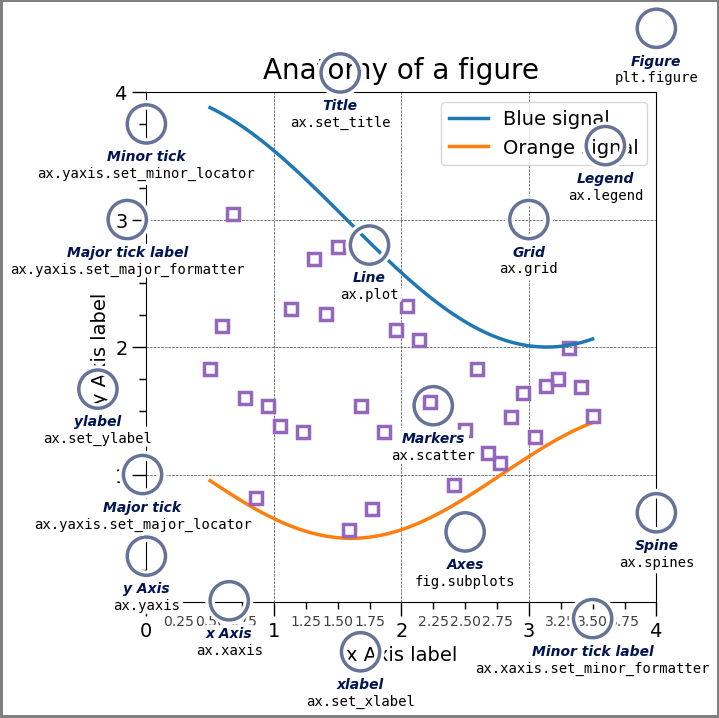
Matplotlib provides a lot of flexibility for getting the figure to look just the way you want.

Read more at Matplotlib Quick Start and take a look at the cheatsheets.