import numpy as np
import matplotlib.pyplot as plt
from matplotlib.ticker import AutoMinorLocator, MultipleLocator
royal_blue = [0, 20 / 256, 82 / 256]
# Figure Data
np.random.seed(19680801)
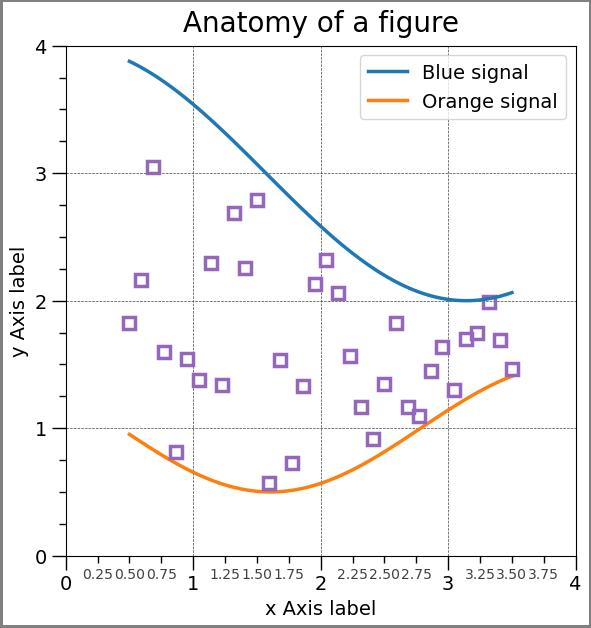
X = np.linspace(0.5, 3.5, 100)
Y1 = 3 + np.cos(X)
Y2 = 1 + np.cos(1 + X / 0.75) / 2
Y3 = np.random.uniform(Y1, Y2, len(X))
# Create Figure
fig = plt.figure(figsize=(7.5, 7.5))
ax = fig.add_axes([0.2, 0.17, 0.68, 0.7], aspect=1)
ax.xaxis.set_major_locator(MultipleLocator(1.000))
ax.xaxis.set_minor_locator(AutoMinorLocator(4))
ax.yaxis.set_major_locator(MultipleLocator(1.000))
ax.yaxis.set_minor_locator(AutoMinorLocator(4))
ax.xaxis.set_minor_formatter("{x:.2f}")
ax.set_xlim(0, 4)
ax.set_ylim(0, 4)
ax.tick_params(which="major", width=1.0, length=10, labelsize=14)
ax.tick_params(which="minor", width=1.0, length=5, labelsize=10, labelcolor="0.25")
ax.grid(linestyle="--", linewidth=0.5, color=".25", zorder=-10)
# Populate Figure
ax.plot(X, Y1, c="C0", lw=2.5, label="Blue signal", zorder=10)
ax.plot(X, Y2, c="C1", lw=2.5, label="Orange signal")
ax.plot(
X[::3],
Y3[::3],
linewidth=0,
markersize=9,
marker="s",
markerfacecolor="none",
markeredgecolor="C4",
markeredgewidth=2.5,
)
# Annotate Figure
ax.set_title("Anatomy of a figure", fontsize=20, verticalalignment="bottom")
ax.set_xlabel("x Axis label", fontsize=14)
ax.set_ylabel("y Axis label", fontsize=14)
ax.legend(loc="upper right", fontsize=14)
# Frame around figure
fig.patch.set(linewidth=4, edgecolor="0.5")
# Based on https://matplotlib.org/stable/gallery/showcase/anatomy.html